Where do accidents occur in Bengaluru?
A glance at a heat map of accidents in Bengaluru (2019 -2022) reveals
that road crashes are not confined to the centre of the city.
In fact, most crashes are concentrated along the highways ,
in the city’s outskirts.
Are these Highways or Urban Roads?
Our highways are supposed to be national and state corridors, but their character indicates something different.
Continuous strip development along our highways results in high footfall and mixed traffic streets.
We can see how crashes concentrate near commercial and industrial estbalishments - especially where local roads intersect with the highway.
These nodes witness high pedestrian activity and vehicle congestion.
Our highways evidently function as urban streets - but aren't designed for it.
This mismatch in infrastructure and usage makes these stretches prone to accidents.
Can we identify patterns of these accidents?
Are there repetitive conditions of where and how these accidents occur on our highways?
Let us explore this through the case of the Banglore- Hosur Highway - South NH 44. This stretch has 17 Blackspots and witnessed 244 crashes in 3 years
Top 10 Crash Patterns
64% of crashes on the South NH44 could be attributed
to the following patterns of location of crash
against type of crash
Pedestrians proved to be the most vulnerable user group on highways, predominantly near Bus Stops.
Let us dive into the top 5 crash patterns.
Hit Pedestrian at Bus Stops
Bus stops are the most dangerous location for pedestrians on the highway.
Highway Crossing Infrastructure not User Friendly
75% of pedestrian crashes at Bus stops occured within walking distance
(a 250m radius) of subways or foot-over bridges. Before crash barriers
were introduced in 2021, pedestrians chose to cross at grade due to
poor maintenance and early closing hours of subways.
Lack of Service Road Crossings and Footpath
The service road connecting stops to subways has no continuous footpath,
so pedestrians walk on the road and cross in front of two-wheelers.
The platform itself is too small — people spill onto the carriageway
and board buses directly from the road, in the path of highway-speed
traffic.
Hit from Back along the Highway
Lorry to two-wheeler crashes
These make up 48% of all crashes on this stretch.
Two-wheelers ride dangerously close to lorries during peak hours,
and at close range fall entirely outside the lorry driver's field of vision
— sudden swerves result in collisions.
Speeding and Night Time
Poor lane marking, insufficient enforcement at merging points,
and the absence of speed calming elements at black spots
and downhill slopes compound the risk.
44% crashes occur at night, where missing road studs,
reflective markings, and adequate lighting
leave little margin for error.
Wrong parking
Wrong parking adds another layer of danger after dark.
Lorries park along the highway due to a lack of designated rest stops or bays,
and reduced visibility means two-wheelers and light motor vehicles crash
into stationary trucks from behind.
Hit from Side/Back at Access Points
Lack of Segregated entries and exits
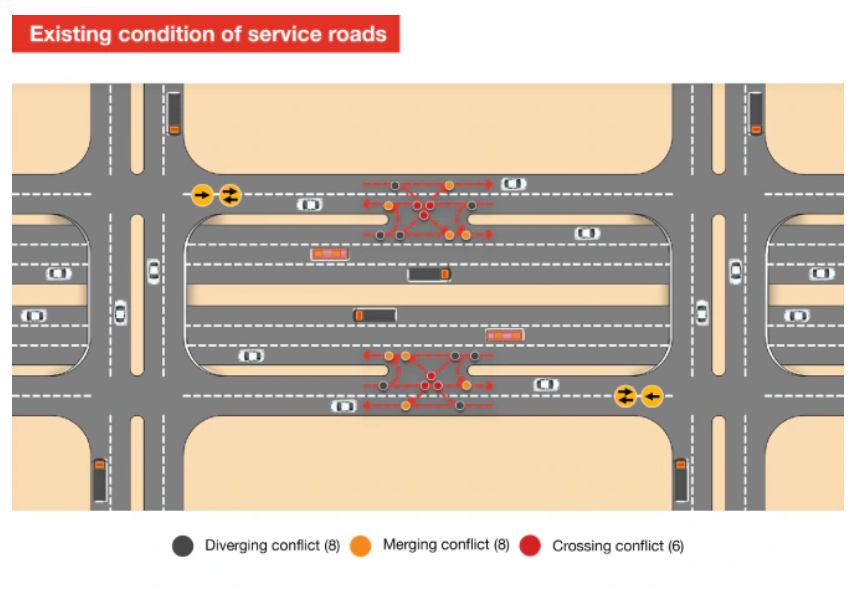
Access points between highways and service roads are inadequately designed.
Median cuts and barricade openings serve as entries and exits simultaneously —
without segregation, these points are high risk. Vehicles speed while
merging into the service road or the main road, increasing chances of
conflict with other vehicles, due to the lack of segregated deceleration
or acceleration lanes.
PWC
identifies this as a recurring concern across state highways.
Heavy to Light Vehicle Conflict
Since this is a critical merge point between lanes and road hierarchies,
two wheelers are again the most vulnerable and have faced most crashes
at these points against lorries, buses and cars.
Head on - Service Roads
The Service Roads on South NH 44 operate as Two Way carriageways.
Out of all Head On collisions on the stretch, 30% occur along the service road.
These collisions predominantly involve two-wheelers, either in crashes
with lorries or with other two-wheelers.
Entries and Exits
There is a diverse mix of land use along the service road
of malls, workplaces, shops, eateries, lodges and markets.
Hence, the service roads are active with high volumes of
pedestrian and vehicular traffic. In addition to local
activity, heavy vehicles use the service road to access
industrial hubs. Due to the two way operation of the
carriageway and its active edge, head on conflicts occur
near building access points along the service road.
Infrastructure
The lack of physical demarcation of lanes, road studs,
faded lane markings, and no speed calming at these
critical zones along the service road catalyses the
possibility of head on conflict.
Hit from back/front - By Lane Intersections
By Lane intersections are either local roads
intersecting with just the service road, or an
intersection between the main highway, service road and
a local road. By Lane Intersection includes T Junction,
Service Road Junction and Intersection Contexts.
Since the service road operates as two way, the
intersections have more possibilities for conflicts.
Infrastructure
The intersections lack road safety elements such as speed
calming elements or physical lane demarcation as the
intersection approaches. The turning radii are often not
appropriate for larger vehicles accessing the local roads.
Signages aren’t adequate on the approaching arms. These
conditions accelerate haphazard vehicular movement at the
intersections.
High risk contexts on the South NH 44
Crash data reveals three repetitive infrastructure gaps on the South NH44. While Along Main Road accounts for the highest number of crashes, this is followed by Access Points, Bus Stops and Intersections.
Together, these contexts account for the majority of all recorded crashes on the South NH 44, pointing to clear patterns in where engineering interventions are most needed.
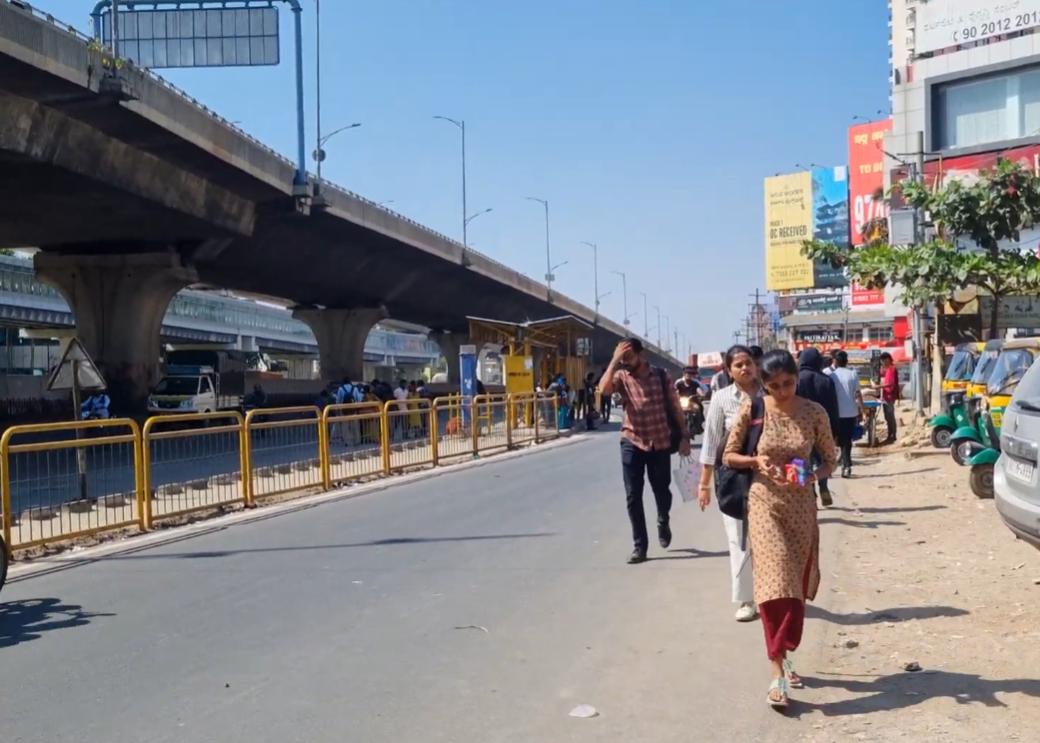 Lack of Footpaths or Crossings at Bus Stops
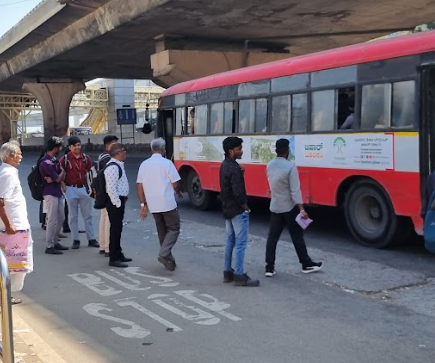 Inadequate space for pedestrians at Bus Stops
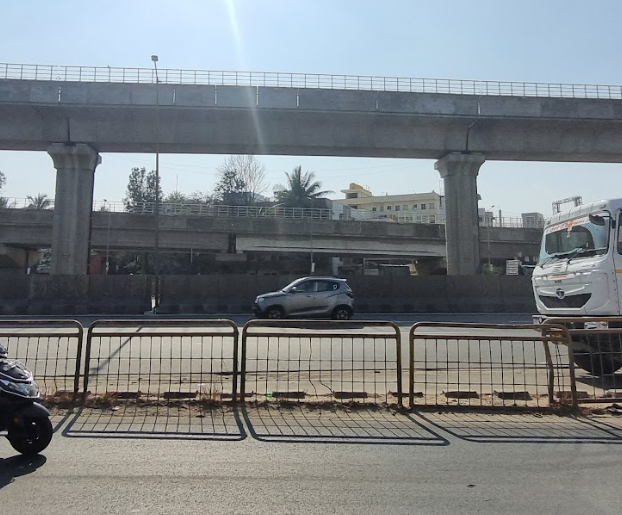 Crash Barriers to prevent Jaywalking
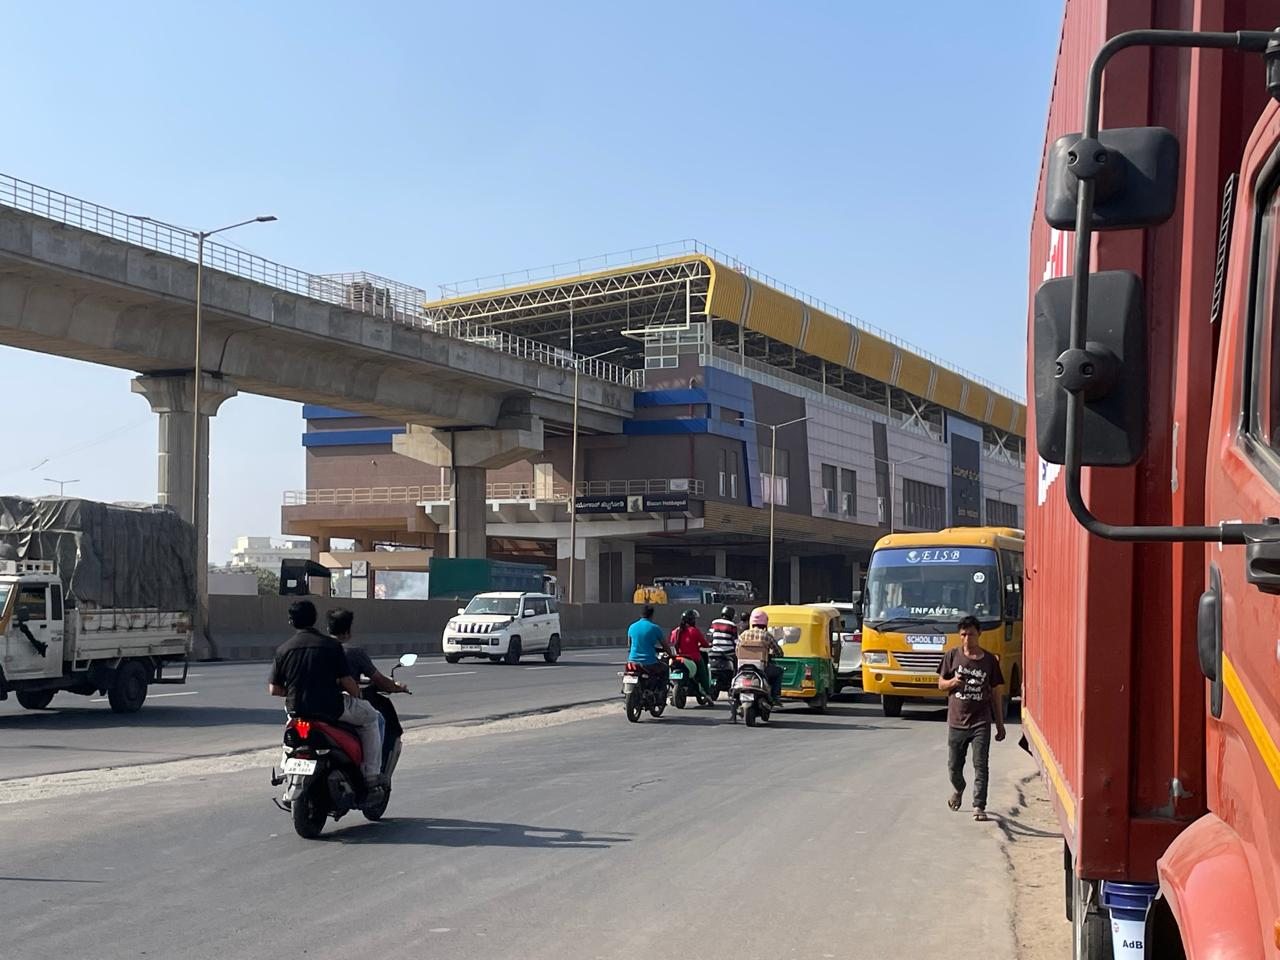
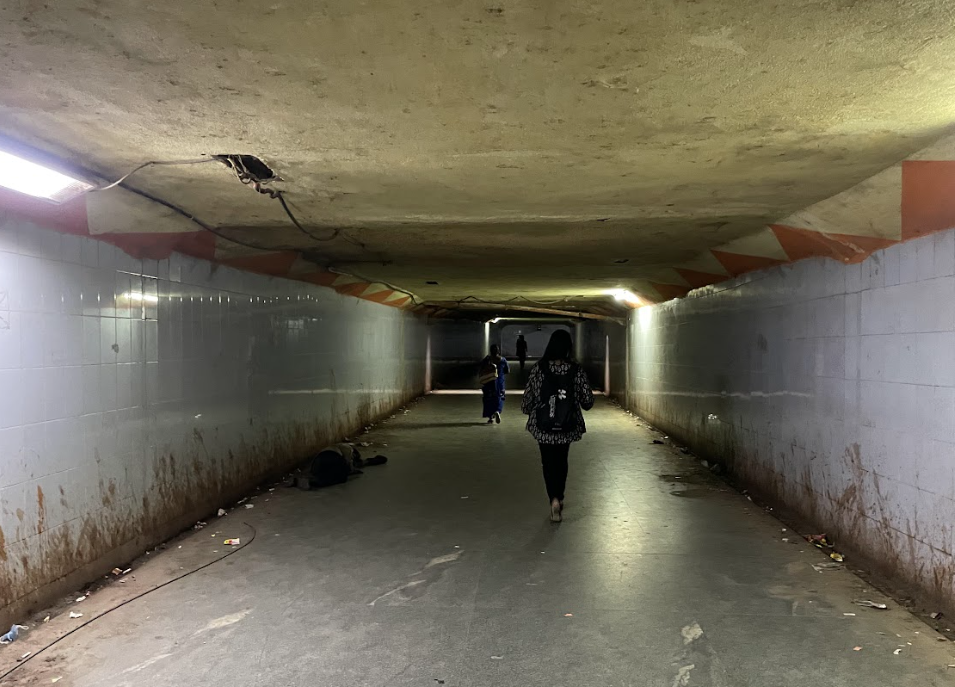 Condition of Subways for Crossing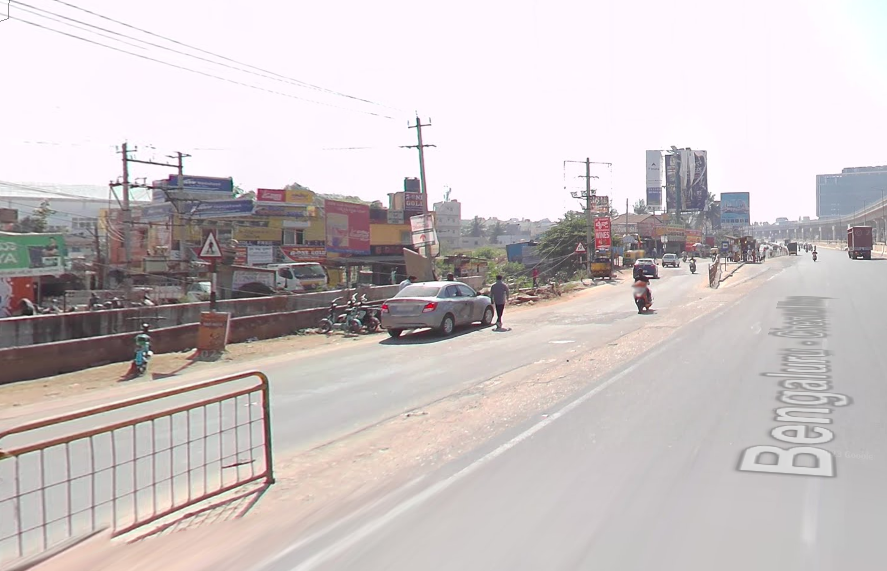
Write your quote here.